Svg Drawings
Hello everybody.
Today I want to share with you simple way to draw Mutual Style Fund box with help of javascript and svg in html5 with usage of module pattern of javascript.
Recently I had task to make at web site drawings with javascript. After some research I decided to use javascript and svg. Here is screenshot of result:
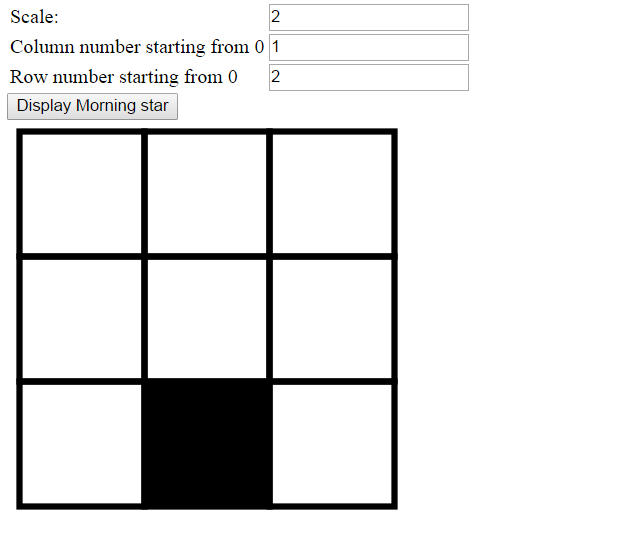
You can choose scaling size and row and column to display.
Here it goes html code:
<!DOCTYPE html>
<html>
<head>
	<title></title>
	<meta charset="utf-8"/>
	<script src="Scripts/jquery-1.10.2.js"></script>
	<script src="Scripts/MorningStar.js"></script>
</head>
<body>
    <script type="text/javascript">
        function Display() {
            var scale = $('#num').val();
            var x = $('#xRect').val(); // in which column to display filled rectangle
            var y = $('#yRect').val(); // in which row to display filled rectangle
            return MorningStarDisplayer.Draw('svgOut', 640, 480, 1280, 960, scale, x, y);
        }
    </script>
    <div>
        <table>
            <tr>
                <td>Scale:</td>
                <td> <!--scaling size-->
                    <input type="number" id="num" value="0.25" />
                </td>
            </tr>
            <tr>
                <td>
                    Column number starting from 0
                </td>
                <td>
                    <input type="number" id="xRect" value="0" />
                </td>
            </tr>
            <tr>
                <td>
                    Row number starting from 0
                </td>
                <td>
                    <input type="number" id="yRect" value="0" />
                </td>
            </tr>
        </table>
        <input type="button" value="Display Morning star" onclick="return Display();"/>
        <br/>
    </div>
    <div id="svgOut">
    </div>
  </body>
</html>
And here goes javascript code of module:
'use strict';
var MorningStarDisplayer = (function (window, undefined) {
    //Here goes variables, which are needed for internal usage.
    var start = '<svg width="{width}" height="{height}" viewBox="0,0,{viewBoxW},{viewBoxH}" xmlns="http://www.w3.org/2000/svg">';
    var continuation = '<g><title>Mutual Fund Style Box</title>';
    var templateRect = '<rect id="svg_{i}" height="100" width="100" y="{y}" x="{x}" stroke-width="5" stroke="#000000" fill="none" />';
    var templateRectFiller = 'fill="none"';
    var svgEnd = '</g></svg>';

    function drawMoringStarChart(idForSvg, width, height, viewBoxW, viewBoxH, scale, fillX, fillY) {
        scale = 1 / scale;
        var resultHtml = '';
        var newStart = start.replace('{width}', width).
            replace('{height}', height).
            replace('{viewBoxW}', viewBoxW * scale).
            replace('{viewBoxH}', viewBoxH * scale);
        resultHtml = resultHtml + newStart + continuation;

        for (var x = 0; x < 3; x++) {
            for (var y = 0; y < 3; y++) {
                var currentX = x * 100 + 10;
                var currentY = y * 100 + 10;

                var rect = templateRect.replace("{i}", x * y)
                    .replace("{y}", currentY)
                    .replace("{x}", currentX);
                if (x == fillX && y == fillY) {
                    rect = rect.replace(templateRectFiller, '');
                }
                resultHtml = resultHtml + rect;
            }
        }
        resultHtml = resultHtml + svgEnd;

        $('#' + idForSvg).html(resultHtml);
    }
     return {
        Draw: drawMoringStarChart
    };
})();
Here you can see, how easier is to use code of module, then to use code of spaghetti code.
Inspired by the simplicity and power of JavaScript and SVG in creating dynamic visualizations like the Mutual Style Fund box? Imagine what custom solutions we can build for your Acumatica platform! Whether you need tailored dashboards, unique reporting tools, or specialized integrations, our team is ready to bring your vision to life.
Leave a customization request today and let’s transform your Acumatica experience into something truly extraordinary. Your business deserves tools that work as hard as you do—let’s build them together!